The 'rolling' graph is of DCF-39's relative signal level over about the last day, updated every two minutes, effectively in'real time'. The yellow curve is DCF-39, the darker green and blue traces the peak signals within adjacent slices of spectrum 7Hz above and below DCF-39's frequency respectively; these give a very loose idea of signal-to-noise ratio, and, should they be abberant at all, a measure of confidence in the measurements overall.
The purpose of taking these measurements and displaying them readily and near instantly is twofold: The 'tactical' purpose is to allow operators on 136kHz to have meaningful clues at their disposal as to the best times to operate, either in the immediate term (when tonight?) or over the course of a few days observation. In the full knowledge that a single measured path such as this, DL to PA, cannot possibly represent all transatlantic paths, never mind others, lies the strategy : making sure that the data recorded is archived and is available to those with the willingness, tools and skill to incorporate it with other data correlated and otherwise, historical present and future, to provide better rationalized and accurate tools for LF propagation prediction.
These notes are to help best interpret the measurements for amateur transatlantic communication.
One should be very careful not to cast too harsh or too dim a light on a given evening's burgeoning progress from DCF-39's plot. Propagation can start later and get higher, or can seem to start out well but turn out ho-hum. Most importantly though is that the path between Magdeburg, DE and Mt. Gretna, PA as captured here will in all likelyhood not behave exactly the same as the path in which you are specifically interested. As has been proved time and again in 'Argo' captures not only across the Atlantic but between 'Lowfers' within the US, the paths between stations only relatively very short distances apart can see very different fading and peaking patterns.
About as much as one can with any assurance draw from this display of DCF-39 is a decent feel for how open the transatlantic path may be, and how stable. If signals recorded here are loud, the chances are it'll be loud for your path too at some point ; if it's looking consistent with few sharp dips, there's a good chance it'll hold up long enough for callsigns to be captured ; prepare for a sleepless night.
Example graphs of really good and really bad propagational nights are given in "Phew! Wot A Scorcher!" . . .
But propagation is only half the story. The other half is whether the signals can actually be copied. Mega-propagation only matters if the noise level at the receive end is low, too.
Signal-to-Noise Ratio
The green and blue 'Noiz' traces on the signal-vs.-time graph are very specific to the measuring system and, frankly, give little real clue as to practical receiving conditions and could give a totally misleading impression of 'signal-to-noise' ratio in any traditional or meaningful sense. A raised 'noise floor' as indicated on the graph represents anything other than the nice fuzzy 'white' noise it looks like; for the most part it is the integrated results of static crashes, each single one of which can punch a hole in a receiving spectrogram. An elevated floor actually gives an indication of the increased frequency (as in rate) of the crashes, just as much as their amplitude. Practically, if the 'noiz' traces are anywhere higher than dithering around the very bottom of the graph, there is probably too much static to consider making sensible captures.
A simplistic subtraction of the 'noizes' from DCF-39's level to give a 'signal-to-noise ratio' on which to base a path budget is flawed and erroneous ; it does not take into account the nature of the noise being measured.
Impulsive noise such as lightning-generated static crashes can be characterised as a high amplitude but short duration pulse. When pulses are few and far between, their integrated (averaged if you like) value over a long period of time is very small. (Iffy analogy time : Pour a full glass of water into an empty bathtub and it'll likely not make the whole bottom wet.) Even fairly dense strikes don't integrate up to much.
The amplitude of pulses even from thunderstorms half a continent away is such that disruption of readings of very low-level signals (remember, transatlantic amateur signals are some 50dB below DCF-39) is a given. The 'noiz' traces simply don't tell one about the damage they're doing ; Spectrograms however give far better clues . . .
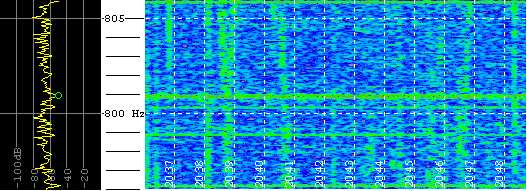
A Good Hair Day
Almost picture perfect. DCF-39 very strong, its modulation 'spread' clearly visible including a neat pair of symmetrical 'zeroes' at +/-2Hz or so, yet nearby Loran lines are still plainly visible. A few, not many, vertical partial crash-streaks can be seen. This would have been a great time to try the transatlantic path.
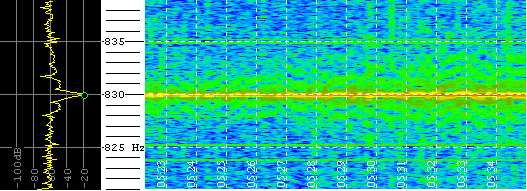
A Bad Hair Day
The spectrogram does a good job of showing up lightning static ; individual crashes show up as vertical bars considerably stronger than the background noise ; as their rate increases the spectrogram tends toward 'white-out' (well, actually greeny-yellowy-brown-out) and at its worst subsumes the usually bright, hard yellow-red trace of DCF-39. The second spectrogram shows it nearly as ugly as it gets.
Even a few light strikes can wreck a spectrogram plot at the levels amateur/lowfer signals typically present.
What is possible?
The three plots are of the maximum peak signal level within a 0.4Hz bandwidth, necessarily much wider than effectively used in QRSS capture. Also, the hi- and lo-'noiz' plots are being taken only at a 'distance' of 7Hz from that of DCF-39; ideally, they'd be in really close, but when DCF-39 gets loud, the modulation 'skirts' from the periodic interruption and FSKing make it quite broad; the 'noiz' plots are still affected by this effect somewhat, and can be seen as a slight correlation between DCF-39 and both 'noizes' when DCF-39 is very loud, say within the top 10-15dB of the graph.
Using 'Argo' or similar, the effective 'visual' bandwidth is the width of one of the program's FFT bins, which can best be counted in milli-Hertz; consequently the 'real' s/n ratio with such tools is considerably greater than indicated here. DCF-39, at some 40kW e.r.p. would be 46dB stronger than a full-tilt-boogie legal EU amateur, 50dB-ish over most exponents - including highly successful ones. There has from time-to-time been enough measured s/n ratio here that such an amateur signal would be comparable with the noise in as much as 1Hz bandwidth. Probably still quite a way from audible copy levels, but likely viewable by those with noisy or less than finely-tuned systems. Even as audibly loud as DCF-39 gets (and it does), I still can't imagine something 50dB quieter being audible over here. (This is stated so that I can be categorically proved wrong, probably tomorrow!).
At the very least, there have been times here where reception has been sufficiently quiet and propagation good enough, resulting in received signals of European amateurs with such a margin that it is estimated stations of well under 100mW ERP would have been easily copiable. See G3AQC and G3LDO in 'Argo Captures'.
Interference - Man-Made Noise
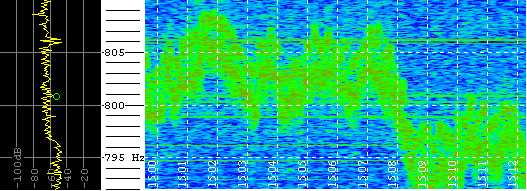
A typical 'Squirgly'
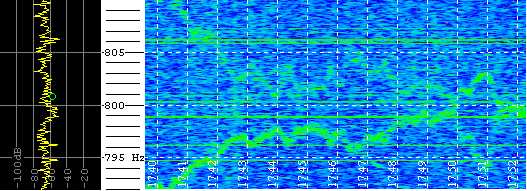
A *_BIG_* 'Squirgly'
Almost unavoidable in this technological age is man-made radio noise. The horrendous 'BUZZ' from lighting dimmers (which WILL ruin plots) aside, the most common sort to be found and fought at LF are the 'squirglies'; the wandering fuzzy harmonic products of the innumerable switch-mode power supplies around us, in 'puters, TVs, radios etc.. Their timing circuits are usually RC defined and notoriously unstable in frequency; their products drift through, back-and-forth across or teasingly glance against a desired frequency. The 'bracketing' of the desired frequency, DCF-39 in this case, by the two control measurements, allows advanced warning of a 'squirgly's' approach - either the hi-noiz or the lo-noiz trace will elevate without the other, and only subsequently DCF-39's trace. The squirgly will dither between one trace and another, very rarely bringing up more than two at once. If, later, a 'noiz' measurement rises in isolation, it can be reasonably assumed that the 'squirgly' has passed on by and depending on the 'squirgly's' level with respect to DCF-39, possibly rendered its measurement between the 'noiz' flags invalid.
The two inset pictures show two 'squirglies; ; the second is of a Big 'Squirgly', most likely the fundamental frequency (or possibly a second harmonic) of a switch-mode power supply's oscillator. Although they're big, and thoroughly make a mess of the graphs, rarely do they reach the level where accurate night-time recording of DCF-39's level becomes compromised. The first inset shows a lower-level 'squirgly', almost certainly a 'daughter' product, one of the many modulation products that show up at 60, 120 or 180Hz intervals from the fundamental.
Since no-one in their right mind is going to be attempting transatlantic QSOs at the typically daytime (here) hours when the readings are fnargled, this serves mostly to corrupt heartily the archived minute-by-minute data. Since, almost unerringly, 'squirglies' show up at sunset too, they do irritatingly bury the detail of a night's propagational start.
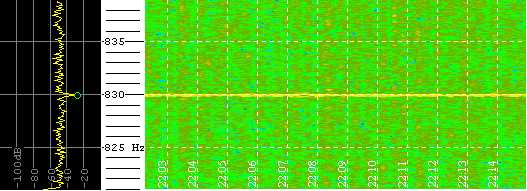
A *BIG* 'Squirgly'
This is a spectrogram of a fairly major 'squirgly' haunting DCF-39's frequency during the daytime. Fairly typically, it is broad (noisy) and unstable and is probably the fundamental (or second harmonic) of an SMPS's oscillator.
An 'interesting' 'Squirgly'
Lower level 'squirglies' look a bit like this - still the trademark instability, but at a lot lower level. A dirty switch-mode supply can spawn dozens of these sweet little things, and where there are a number of SMPSs they can form almost a carpet of low-grade spectral gark, constantly in the way of decent plots. This one is a little intriguing, since a weaker but obviously related inversed 'image' at twice the frequency rate has appeared simultaneously ; not got this one figured out yet, but it is suspected to be an alias from the sound-card's A/D acting on a not-quite-succesfully filtered second harmonic.
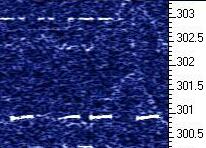
Low-level 'Squirgly'
Lastly, a partial 'Argo' capture, spoiled by a low-level 'squirgly'. Without continuous effort to identify the sources of these, one will be constantly plagued by them. The tracking pair of fuzzies in this 'Argo' out-take are almost certainly supply modulation artifacts from an SMPS, and are spectrally all over the place. It is a sad fact of life that the large majority of switch-mode supplies operate between 100 and 300kHz . . .